
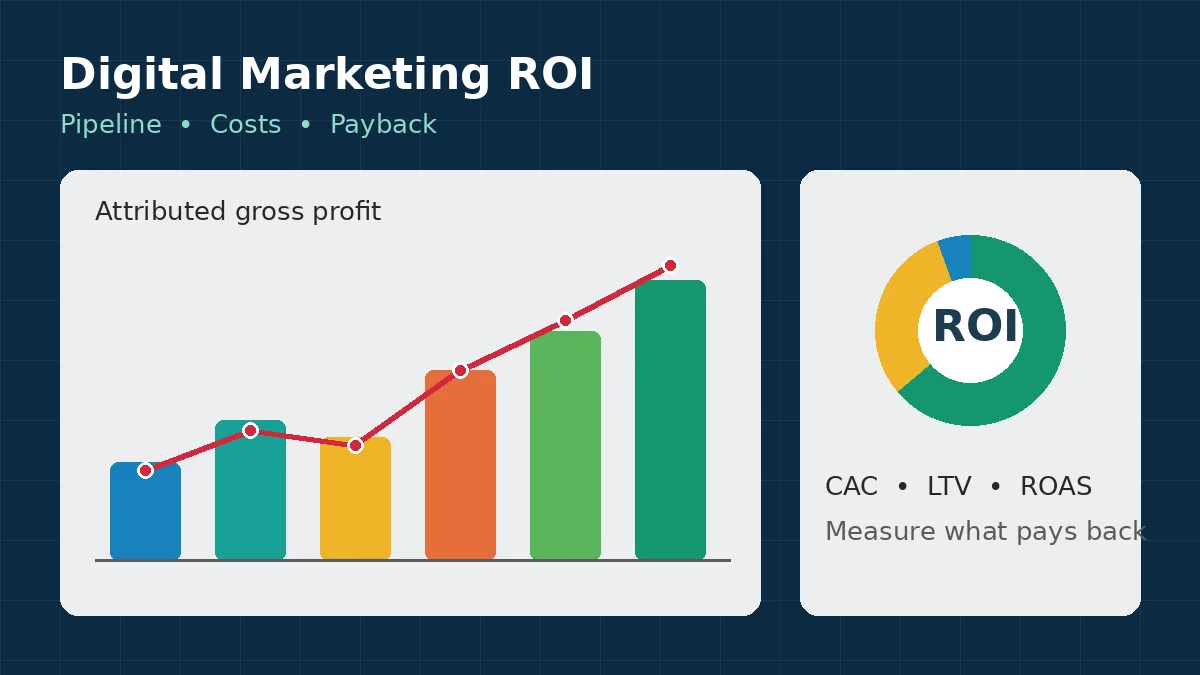
A Kraków consultancy can spend a full quarter on campaigns and still feel unsure. Reports show clicks, impressions, and colourful charts. Bank balances, however, tell a quieter story. That gap frustrates owners because services sell slowly and quietly.
Digital marketing ROI sounds simple until a real sales cycle begins. A prospect reads a guide in spring and signs in autumn. Meanwhile, three colleagues also join the decision along the way. Consequently, one tidy monthly number rarely captures the whole truth.
This guide gives business services firms in Kraków a calmer method. Specifically, it shows how to define return before spending anything. It also explains fully loaded marketing costs in plain language. Finally, it connects pipeline metrics, attribution, and payback into one routine.
Why Does ROI Feel So Slippery for Services Firms?
Product businesses count units, baskets, and instant checkouts with ease. Services firms, by contrast, sell judgement, trust, and future delivery. A signed contract therefore arrives weeks after the first click. Moreover, the value of that contract unfolds over many months.
Referrals complicate the picture even further for Kraków teams. A happy client recommends your firm at a dinner or conference. Later, the new prospect searches your name and clicks an advert. Which channel earned that client, honestly? Neither dashboard answers that question alone.
Language adds another layer for firms selling beyond Poland. Many Kraków firms serve local clients in Polish and regional clients in English. Campaigns therefore run in two languages with different buying habits. As a result, blended averages often hide what actually works.
None of this makes measurement impossible, thankfully. Instead, it means measurement needs a framework built for long cycles. Firms exploring redefining business services excellence through digital marketing usually reach the same conclusion quickly. Clear definitions come first, and dashboards come second.
What Should Count as Return in the First Place?
Arguments about ROI usually start with a hidden disagreement. One person means revenue, while another quietly means profit. A third person, meanwhile, means new enquiries this month. Until everyone agrees, every calculation produces a different argument.
Start, therefore, by naming your return on marketing investment precisely. For most services firms, gross profit from won work works best. Revenue flatters campaigns because delivery costs stay invisible inside it. Gross profit, in contrast, respects the real cost of serving clients.
Revenue, Gross Profit, or Pipeline Value?
Revenue suits quick checks when margins stay broadly similar. Gross profit suits decisions because it shows money actually kept. Pipeline value, however, suits early judgement before deals have closed. Each measure answers a different question at a different time.
Your gross profit margin shapes every one of these choices. Two firms can win identical contracts with very different margins. Consequently, the same campaign can delight one firm and disappoint another. Always judge return against your own margin, never borrowed benchmarks.
Pipeline value also deserves a careful, honest definition internally. Count only opportunities that sales has accepted and qualified properly. Inflated pipelines, by contrast, make weak marketing look heroic for months. Eventually, reality corrects the story, usually at an awkward meeting.
The Core Marketing ROI Formula, Step by Step
The standard marketing ROI formula stays refreshingly simple at heart. Take gross profit attributed to marketing during a period. Next, subtract the fully loaded marketing costs for that period. Then divide the result by those same marketing costs.
Multiply the outcome by one hundred for a percentage figure. A positive result means marketing returned more than it consumed. A negative result, meanwhile, means spend outran the profit it created. Neither result, however, explains itself without the workings behind it.
Keep the formula fixed once your leadership team agrees it. Changing definitions mid-year quietly destroys every useful comparison you own. Similarly, changing attribution windows mid-year creates the same confusion. Consistency, above all, turns scattered numbers into a trustworthy trend.
| Measure | Simple Definition | Best Used For |
|---|---|---|
| Digital marketing ROI | Attributed gross profit minus total cost, divided by total cost | Overall programme judgement |
| Return on ad spend | Attributed revenue divided by advertising spend alone | Quick paid media checks |
| Customer acquisition cost | Total marketing cost divided by new customers won | Comparing channels fairly |
| Payback period | Months needed for gross profit to cover acquisition cost | Cash flow planning |
Notice how return on ad spend uses revenue and media only. It therefore answers a narrower question than full ROI. Confusing the two, however, remains the commonest reporting mistake everywhere. Keep both, certainly, but never present one as the other.
Count the Full Cost, Not Just the Advert Spend
Most ROI disappointments begin with an incomplete cost column. Teams count advert spend because invoices make it painfully visible. Meanwhile, salaries, tools, and creative work slip quietly out of sight. The resulting figure looks healthy, yet it rests on fiction.
Fully loaded marketing costs include every resource a campaign consumes. Agency fees belong there, alongside freelancer and production invoices. Software subscriptions belong there too, from analytics to design tools. Internal staff time, above all, belongs there at a realistic rate.
- Media spend across search, social, and display campaigns
- Agency, consultant, and freelancer fees for the period
- Content writing, design, video, and translation costs combined
- Marketing software, analytics tools, and CRM subscription shares
- Internal salaries for hours genuinely spent on marketing work
- Landing page, website, and campaign development costs apportioned
Translation deserves a special mention for Kraków firms specifically. Bilingual campaigns need Polish and English versions of key pages. That work costs real money and real review time. Including it honestly, therefore, keeps cross-border ROI comparisons meaningful.
Apportion shared costs with a simple, written rule instead. For example, assign a fixed share of a salary monthly. Alternatively, track campaign hours for one quarter and review them. Either method beats perfectionism, because rough honesty beats precise fiction.
Firms reviewing digital transformation in business often discover hidden costs at this stage. Old tools overlap, while unused subscriptions renew quietly each year. Cleaning the cost base, consequently, improves ROI before campaigns even change.
Which Pipeline Metrics Connect Spend to Actual Sales?
Between a click and a contract sits a long pipeline. Pipeline metrics illuminate that journey in manageable, honest stages. They show where interest becomes opportunity and opportunity becomes revenue. Without them, however, teams judge everything by final sales alone.
Define each pipeline stage in writing with sales colleagues. Marketing qualified leads meet agreed profile and interest criteria clearly. Sales qualified leads have passed a real conversation and qualification check. Opportunities, meanwhile, carry a defined scope, value, and next step.
From First Enquiry to Accepted Opportunity
Track conversion rates between stages, not just raw volumes. A channel may deliver many enquiries with poor fit. Another channel, by contrast, delivers fewer enquiries that progress beautifully. Cost alone cannot reveal that difference, whereas stage rates can.
Pipeline contribution deserves a regular place in monthly reporting too. It records the value of accepted opportunities marketing sourced or influenced. Leadership, therefore, sees momentum long before slow deals finally close. Morale improves as well, because good early work becomes visible.
Segment every pipeline figure by service line where possible. A firm may sell audits, retainers, and implementation projects together. Each service, however, carries different margins, cycles, and close rates. Blended reporting, consequently, hides the services that genuinely fund growth.
Cost per Qualified Lead, CAC, and Lifetime Value
Cost per qualified lead divides channel spend by qualified enquiries. It disciplines teams far better than cost per raw lead. Unqualified volume looks cheap, yet it consumes expensive sales time. Qualification, in short, separates curiosity from genuine buying potential.
Customer acquisition cost goes one decisive step further downstream. Divide total marketing cost by new customers actually won. Then compare that figure across channels, campaigns, and quarters calmly. Rising acquisition costs, for instance, may signal fatigue or poor targeting.
Customer lifetime value completes this trio of core measures. Estimate gross profit expected across the whole client relationship realistically. Include likely renewals, expansions, and repeat projects in that estimate. Exclude hopeful guesses, however, because optimism quietly corrupts every ratio.
The relationship between lifetime value and acquisition cost guides ambition. Healthy economics allow a firm to invest confidently in visibility. Strained economics, by contrast, demand tighter targeting and faster payback. Neither judgement needs industry folklore, just your own honest figures.
Strong B2B lead generation also protects these ratios over time. Helpful content keeps earning enquiries long after publication day ends. That compounding effect, notably, separates content investment from rented attention. Readers of the future of business services and digital marketing will recognise this pattern.
How Should You Handle Attribution Without Fooling Yourself?
Attribution decides which touchpoints receive credit for a win. Every attribution model makes assumptions, and every assumption favours someone. First-touch models reward whatever started the journey months earlier. Last-touch models, meanwhile, reward whatever closed the journey yesterday.
Multi-touch attribution spreads credit across several recorded interactions instead. Linear versions share credit equally between all tracked touchpoints. Position-based versions, however, emphasise first and last touches more heavily. Time-decay versions favour touches closest to the final conversion.
Choosing a Model That Fits a Long Sales Cycle
Long cycles make single-touch models especially misleading for services. A whitepaper download may start a relationship that adverts later nurture. Awarding everything to the final click, therefore, starves early education. Awarding everything to the first click, conversely, ignores persistent follow-up.
Pick one primary model and use it consistently instead. Review a second model occasionally as a sanity check only. Endless model switching, notably, lets every channel claim victory somewhere. Discipline, by contrast, keeps budget conversations grounded in shared reality.
Match your attribution window to your real buying cycle. Short windows suit fast, transactional purchases with brief consideration. Services decisions, however, unfold across budget rounds and internal approvals. Longer windows therefore capture journeys that short windows silently truncate.
Self-Reported Answers and the Invisible Journey
Some influence never appears inside any analytics platform anywhere. Prospects hear podcasts, attend events, and receive private recommendations daily. Colleagues also forward articles inside chats that tracking cannot follow. Analysts often call these hidden paths the dark funnel.
Ask new clients one simple question during onboarding calls. How did you first hear about our firm, exactly? Record the answer inside the CRM beside campaign data. Patterns emerge slowly, and they often surprise confident marketing teams.
Combine self-reported answers with modelled attribution for balance overall. Neither source tells the complete story on its own. Together, however, they expose blind spots that budgets depend on. Honest uncertainty, in fact, beats confident fiction every single quarter.
Firms studying the global impact of digital marketing face this challenge at scale. Cross-border journeys scatter touchpoints across languages, platforms, and time zones. A shared attribution rule, consequently, becomes even more valuable there.
Why Does Payback Period Matter Alongside ROI?
A campaign can promise excellent returns and still strain cash. Services firms pay salaries and invoices every single month. Client payments, meanwhile, arrive according to contracts and payment habits. Timing, therefore, matters almost as much as the final percentage.
The payback period measures how long recovery actually takes. Divide acquisition cost by expected monthly gross profit per client. The result estimates months needed to earn the cost back. Shorter payback, generally, means safer growth for smaller firms.
Use payback to sequence investments with limited budgets wisely. Fund faster-paying activities before slower, strategic brand building begins. Then reinvest recovered cash into content and authority assets gradually. This sequencing, notably, keeps ambition compatible with monthly payroll.
Retainers and recurring services naturally change the payback picture. Monthly gross profit accumulates steadily across a longer client relationship. One-off projects, by contrast, must repay acquisition costs almost immediately. Compare payback within service types, therefore, never across them blindly.
Leaders planning scaling small business growth with digital marketing face this sequencing question constantly. Growth consumes cash before it returns cash, almost always. Payback discipline, consequently, turns growth from a gamble into a plan.
How Do Channels Differ When You Read Their ROI?
Each channel returns value on a different clock entirely. Paid search can generate enquiries within days of launch. Search engine optimisation, however, builds visibility gradually across many months. Judging both monthly, therefore, rigs the contest before it starts.
Content assets keep working while advert budgets pause nightly. A strong guide answers buyer questions for years without rent. Its cost per qualified lead, consequently, falls steadily over time. Paid campaigns, in contrast, stop delivering the moment spending stops.
LinkedIn activity suits relationship-led selling for many services firms. Decision makers gather there, and thoughtful posts build familiarity slowly. Email nurturing, meanwhile, keeps warm prospects engaged between buying moments. Both channels influence deals that other channels later claim.
Judge every channel across a window matching its nature. Compare rolling quarters for slower, compounding channels like content. Compare campaigns within similar seasons for paid media instead. Fair windows, above all, prevent panic cuts and reckless scaling.
Local search deserves separate attention for Kraków-based teams too. Some clients search locally, while others search nationally or internationally. Split local and wider campaigns inside your reporting structure. Clarity improves, consequently, because each audience buys in different ways.
Firms refining redefining business excellence through digital marketing usually segment channels this way early. Segmentation feels tedious initially, yet it prevents expensive misreadings later. Small, consistent categories, in practice, beat elaborate taxonomies nobody maintains.
A Worked Hypothetical Example, From Start to Finish
Imagine a hypothetical Kraków firm running one quarterly campaign. This example uses invented figures purely to teach the method. No real company, client, or market result appears here. Follow the logic, then replace every figure with your own.
Suppose the campaign carries fully loaded costs of fifteen thousand. That total includes media, writing, design, tools, and staff time. During the following two quarters, six new clients arrive attributed. Their contracts produce sixty thousand in revenue overall combined.
Assume a gross profit margin of fifty percent throughout. Attributed gross profit therefore equals thirty thousand in this example. Subtract fifteen thousand costs, and fifteen thousand remains as net return. Divide that by fifteen thousand, and ROI equals one hundred percent.
| Hypothetical Item | Figure | How It Was Derived |
|---|---|---|
| Fully loaded campaign cost | 15,000 | Media, content, tools, and staff time combined |
| New clients attributed | 6 | CRM records matched to the campaign |
| Attributed revenue | 60,000 | Signed contract values from those clients |
| Attributed gross profit | 30,000 | Revenue multiplied by a 50 percent margin |
| Digital marketing ROI | 100 percent | Profit minus cost, divided by cost |
| Customer acquisition cost | 2,500 | Total cost divided by six new clients |
Now add payback to complete the hypothetical picture properly. Each client yields five hundred monthly gross profit on average. Acquisition cost per client equals two thousand five hundred here. Payback therefore takes roughly five months per client acquired.
Notice which assumptions carry the whole result here. Margin, attribution, and cost completeness change everything about it. Change any assumption, and the headline percentage moves immediately. Transparent assumptions, consequently, matter more than impressive-looking headline numbers.
What Does a Simple Monthly ROI Routine Look Like?
Good measurement survives because the routine stays deliberately small. One owner, one monthly session, and one shared dashboard suffice. A marketing analytics dashboard should show costs, pipeline, and profit together. Separate reports, by contrast, invite separate and conflicting stories.
- Close the cost ledger for the month with finance.
- Match new clients and opportunities inside the CRM carefully.
- Update pipeline stages using the agreed written definitions.
- Calculate ROI, acquisition cost, and payback by channel.
- Record one clear decision and one test for next month.
Tag every campaign link with consistent UTM parameters always. Name campaigns identically across platforms, emails, and advert accounts too. Hidden form fields, meanwhile, can capture the landing page automatically. Small habits like these, notably, rescue attribution months later.
Review trends quarterly rather than reacting to weekly noise. Services pipelines move slowly, and small samples swing wildly. A single large client, for example, can distort one month completely. Quarterly views, therefore, reveal whether change is real or accidental.
Document every definition change with a date and reason. Future readers will thank you during confusing comparisons later. Memory fades quickly, whereas written definitions preserve hard-won clarity. That documentation, in effect, becomes part of your measurement asset.
Leaders exploring the ROI of digital marketing for business services firms often start exactly here. Definitions, costs, and pipeline discipline create the foundation first. Advanced software, notably, only helps after those basics hold.
Which Mistakes Quietly Destroy Marketing ROI?
Vanity metrics top the list of quiet ROI killers. Impressions and followers feel encouraging during difficult months, certainly. They pay no salaries, however, and they fund no growth. Tie every reported metric, therefore, to pipeline or profit eventually.
Optimising for cheap leads damages returns in subtler ways. Sales teams waste hours chasing enquiries that never fitted. Morale drops, follow-up slows, and good prospects wait longer consequently. Expensive-looking qualified leads, by contrast, often produce the cheapest customers.
Ignoring existing clients wastes the strongest return available anywhere. Retention, expansion, and referrals cost less than cold acquisition typically. Content for current clients, notably, deepens relationships between formal review meetings. Loyal clients also introduce prospects who arrive already trusting you.
Finally, inconsistent tracking quietly invalidates years of careful comparisons. Renamed campaigns and missing tags break trends without any warning. Assign one person to guard naming conventions and definitions. Boring governance, in truth, protects exciting growth from self-deception.
Frequently Asked Questions
What is a good digital marketing ROI for a services firm?
No universal figure exists, despite what confident listicles claim. Good depends on your margin, payback needs, and capacity. Compare against your own history and fully loaded costs instead. A smaller honest return, notably, beats a larger fictional one.
How often should a Kraków firm calculate marketing ROI?
Review pipeline signals monthly and full ROI quarterly instead. Monthly sales data swings too sharply for slow services cycles. Quarterly reviews, meanwhile, match how contracts actually close locally. Annual reviews then guide budget size and strategic direction overall.
Should small firms use multi-touch attribution from the start?
Start simple, certainly, and add complexity only when needed. Consistent CRM records and self-reported answers already improve decisions greatly. Multi-touch attribution helps later, once journey data becomes reliable enough. Software cannot rescue messy records, however advanced it looks.
Why does ROI look worse after counting full costs?
Honest costs reveal the programme you actually run daily. Earlier figures simply omitted salaries, tools, and production expenses. The campaigns did not change, whereas the accounting finally did. Better decisions follow, because budgets now reflect reality more closely.
Final Thoughts: Measure Slowly, Decide Clearly, Improve Steadily
Digital marketing ROI rewards firms that define terms early. Honest costs, agreed pipeline stages, and fair attribution windows help enormously. Payback, meanwhile, keeps profitable growth compatible with real cash flow. Together, consequently, these habits turn reporting into a decision tool.
Kraków business services firms compete on trust above everything. Measurement should reflect that trust-based reality rather than hide it. Track what clients actually did, not what dashboards merely counted. Then improve one stage, one channel, and one definition at a time.